The Supermassive Black Hole at the Galactic Center—EHT Observational Data re-analysed and High-velocity rotating Accretion Disk found?
- Date
- October 25, 2024
- Researchers
- Makoto Miyoshi (National Astronomical Observatory of Japan, JASMINE Project, Assistant Professor)
- Yoshiaki Kato (Japan Meteorological Agency, Numerical Prediction Division, Information Infrastructure Department, Technical Specialist)
- Junichiro Makino (Kobe University, Graduate School of Science, Department of Planetology, Distinguished Professor)
Summary
A new re-analysis of the data observed by the Event Horizon Telescope (EHT) suggests that the ring-like image reported in 2022, purporting to show the supermassive black hole at the centre of the Milky Way (Sgr A*), is unlikely to be an accurate representation.
The new analysis shows a shape elongating from east to west, consistent with the previous high-resolution observations. This image probably shows an accretion disk rotating around the black hole at about 60% of the speed of light.
Due to the Doppler effect caused by this high-velocity rotation, the eastern side appears brighter and the western side darker, indicating the region close to the black hole, within two to several times the Schwarzschild radius.
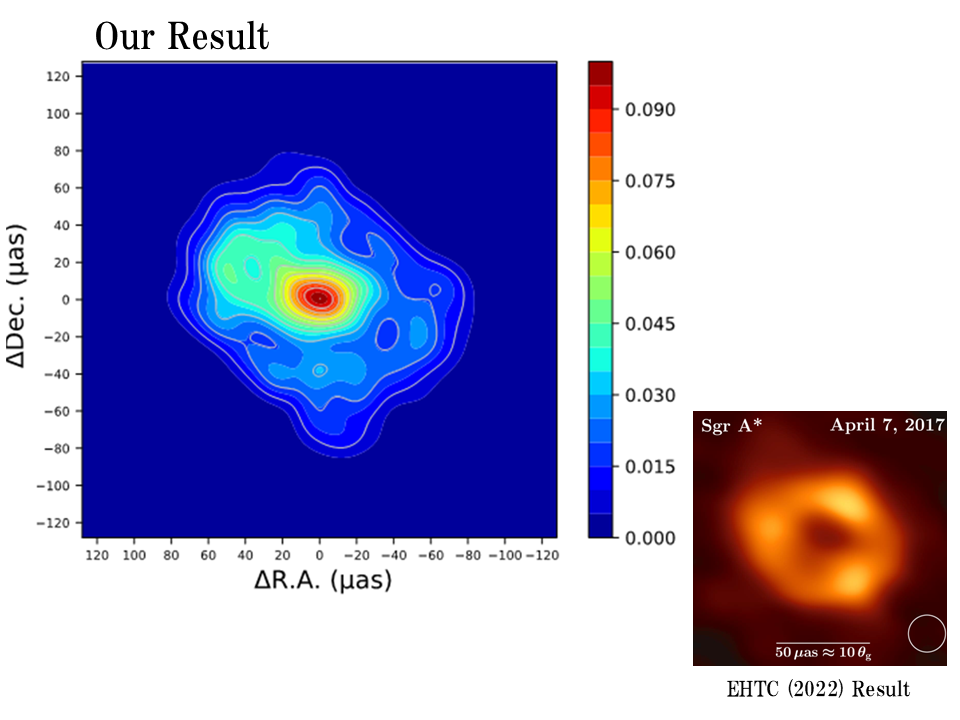
Figure 1: The reanalysed image of the supermassive black hole (Sgr A*) at the centre of the Milky Way. The areas of higher radio intensity are shown in red, while the weaker areas are shown in blue. The image is elongated east to west, with the eastern side appearing brighter and the western side darker. This effect is thought to be due to the Doppler boosting effect caused by the high-velocity rotation of the accretion disk. The eastern side, which is rotating toward us, appears brighter, while the western side, which is rotating away, appears darker. The lower right shows the image reported by EHTC for reference.
Announcement
The Event Horizon Telescope Collaboration (EHTC), has reported images of black holes. The center of our Milky Way galaxy contains a supermassive black hole (Sgr A), approximately 4 million times the mass of the Sun, a discovery that earned the Nobel Prize in Physics in 2020 for Reinhard Genzel (Germany) and Andrea Ghez (USA). EHTC observed Sgr A in 2017 and published its findings in 2022, reporting a ring with a diameter of approximately 50 micro arcseconds as the black hole image. However, we reanalyzed the public EHT observational data and obtained an elongated image extending east-west, not a ring.
Is our image or EHTC's ring image correct? We compared how well both match the observation data. EHTC's ring image showed a residual twice as large as ours, indicating our image aligns better with the data and is more reliable.
Why Did the Ring Image Emerge?
Why, then, did the ring image with a diameter of 50 micro arcseconds emerge? No telescope can capture an astronomical image perfectly. Telescopes often produce blurry, circular images of stars, known as the "Point Spread Function" (PSF). When examining the PSF structure of the EHT, we discovered much rougher irregularities compared to ordinary telescopes (see Figure 2).
We hypothesized that the ring image resulted from errors in the deconvolution process of the PSF structure during EHTC's imaging analysis and examined the PSF of the EHT closely. We found a primary side lobe at 49 micro arcseconds from the main beam with an intensity of 49 percent, and a deep negative dip at the midpoint between them, reaching -89 percent of the main beam intensity. The measured black hole shadow diameter matched this interval exactly.
EHTC's image also showed three prominent bright spots on the ring. The positional relationship of these spots corresponds to the positions of the main beam, the northern first sidelobe, and the eastern sidelobe in the PSF structure.
Additionally, after deconvolution, EHTC's ring image was synthesized into a clean image using a circular restoration beam of 20 micro arcseconds. However, the shape of the "black hole shadow" portion seen in the center of the image matched the shape of the main beam portion of the PSF.
Thus, there are multiple similarities between EHTC's ring image and the PSF structure. This suggests that the EHTC imaging process had issues with PSF deconvolution, and the resulting image might reflect the PSF characteristics rather than the actual astronomical structure.
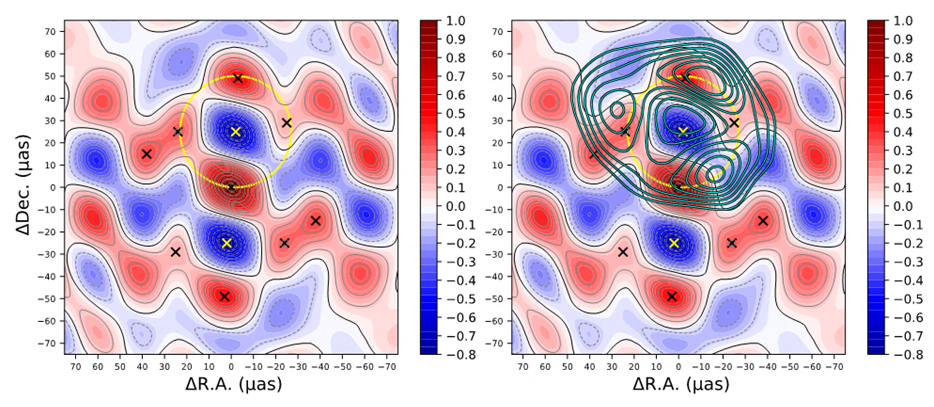
Figure 2: The 'Point Spread Function (PSF)' shows the characteristics of the EHT as a telescope. This diagram shows how an object that is a perfect point source is imaged. (In actual data analysis, the effects of the PSF structure are removed to produce a clear image.) Red indicates positive values and blue indicates negative values. Deep negative dips appear 25 micro arcseconds north and south (up and down in the figure) from the central main beam (yellow × marks). If we draw a circle with a diameter of 50 micro arcseconds (yellow dotted line) centred on this northern depression, multiple peaks (black × marks) lie on the circumference. The distance between the main beam and the (second highest) first sidelobe is 49 micro arcseconds. This exactly matches the diameter of the black hole shadow measured by EHTC (48.7 ± 7.0 micro arcseconds). In the figure on the right, we have superimposed the ring image reported by EHTC using green contour lines. The three bright spots on the ring roughly correspond to three peaks in the PSF.
EHTC's Imaging Analysis Process
In order to remove errors in the observed data (called data calibration), the EHTC imaging analysis process makes some assumptions about the Sgr A* image from the outset. For one thing, the size of Sgr A* is assumed to be 60 micro arcseconds and the amplitudes of some of the observational data are calibrated. In addition, because the structure of Sgr A* changes during the observations, and to mitigate the effects of the variation, the observational data are weighted using knowledge from General Relativistic Magnetohydrodynamics (GRMHD) simulations, i.e. estimates about the structure of the object and its physical conditions. This means that assumptions are made from the outset about the observational imaging results, in other words which are not imaging in the pure sense of the word.
Furthermore, in the imaging analysis process, the EHTC uses their own criteria to select the final imaging results. Normally, the final imaging result is selected on the basis of the consistency of the observational data and the imaging result; the EHTC has instead selected a shape (ring-like) that appears most frequently in a large number of imaging results obtained with a large number of imaging parameters as the final image.
Our concern is that the imaging analysis process used by the EHTC as described above may not deconvolve the PSF structure correctly and the resulting image may reflect the structural features of the PSF rather than the structure of the observed object.
Our Independent Analysis
In our independent analysis, we used the imaging analysis method that has been traditionally used to derive the images. In other words, we used a widely accepted method called the hybrid mapping method. In this method, we use the CLEAN algorithm to perform PSF deconvolution, and then perform a calibration method for the observation data called self-calibration.
This is a method that gradually determines the observed astronomical image by iteratively alternating between these two tasks. In using the hybrid mapping method, we followed the established precautions. We then compared the resulting image with the PSF structure. We confirmed that it did not share the characteristics of the PSF structure, and finally, we selected the image that was most consistent with the observation data as the final image. The result is shown in Figure 1.
High-velocity Rotating Accretion Disk
The image we obtained was elongated from east to west. The eastern half of the image is brighter than the western half. This difference in brightness between east and west is probably due to the Doppler boost effect caused by the rapidly rotating accretion disc. When an object emitting light approaches at a speed close to the speed of light, it appears to shine brighter due to the Doppler boost effect. Conversely, if it is moving away from us at a speed close to the speed of light, it will appear to be dimmer than it really is.
This phenomenon is basically the same as the Doppler effect. The eastern side of the disc (left in the figure) is thought to rotate towards us and the western side (right in the figure) away from us. Our measurements suggest that there is an accretion disc around the black hole, and that we can see the area around the black hole that is two to several times the Schwarzschild radius (the radius of the area around the black hole from which nothing, including light, can escape). The accretion disc is rotating at about 60% of the speed of light there (Figure 3).
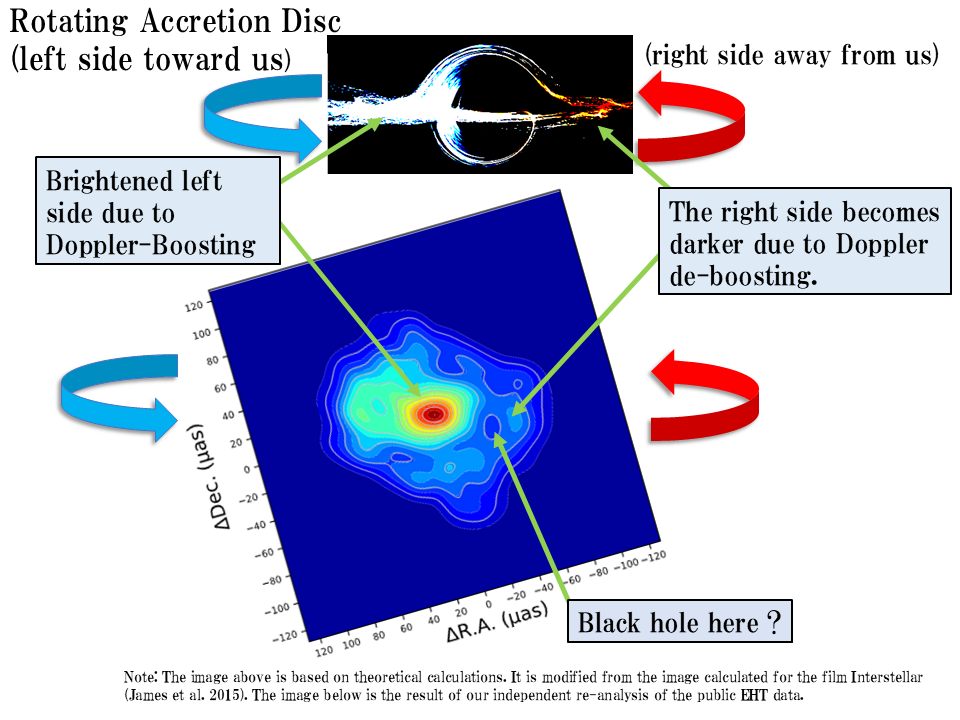
Figure 3: Why does the brightness appear to be different in the eastern and western halves? We think this is due to the Doppler boost effect caused by the accretion disc rotating at 60% of the speed of light.
Publication Information
This research was published in the Monthly Notices of the Royal Astronomical Society (MNRAS) on October 25, 2024.
- Paper Title: "An independent hybrid imaging of Sgr A* from the data in EHT 2017 observations"
- Authors: M. Miyoshi, Y. Kato, and J. Makino
- Journal: Monthly Notices of the Royal Astronomical Society
- DOI: 10.1093/mnras/stae1158
- Japanese Translation: PDF